Reports & KPIs
Reporting without the spreadsheet export
Build custom reports over your real work, tasks, approvals, projects, and tracked time, and track the KPIs that matter on a live dashboard. Start from presets, save the reports you rely on, and view them as lines, bars, or doughnuts.
- Query tasks, approvals, projects, and time tracking
- Group by status, assignee, project, or time period
- KPI cards: completion rate, throughput, turnaround, and more
- Presets and saved reports, no manual exports
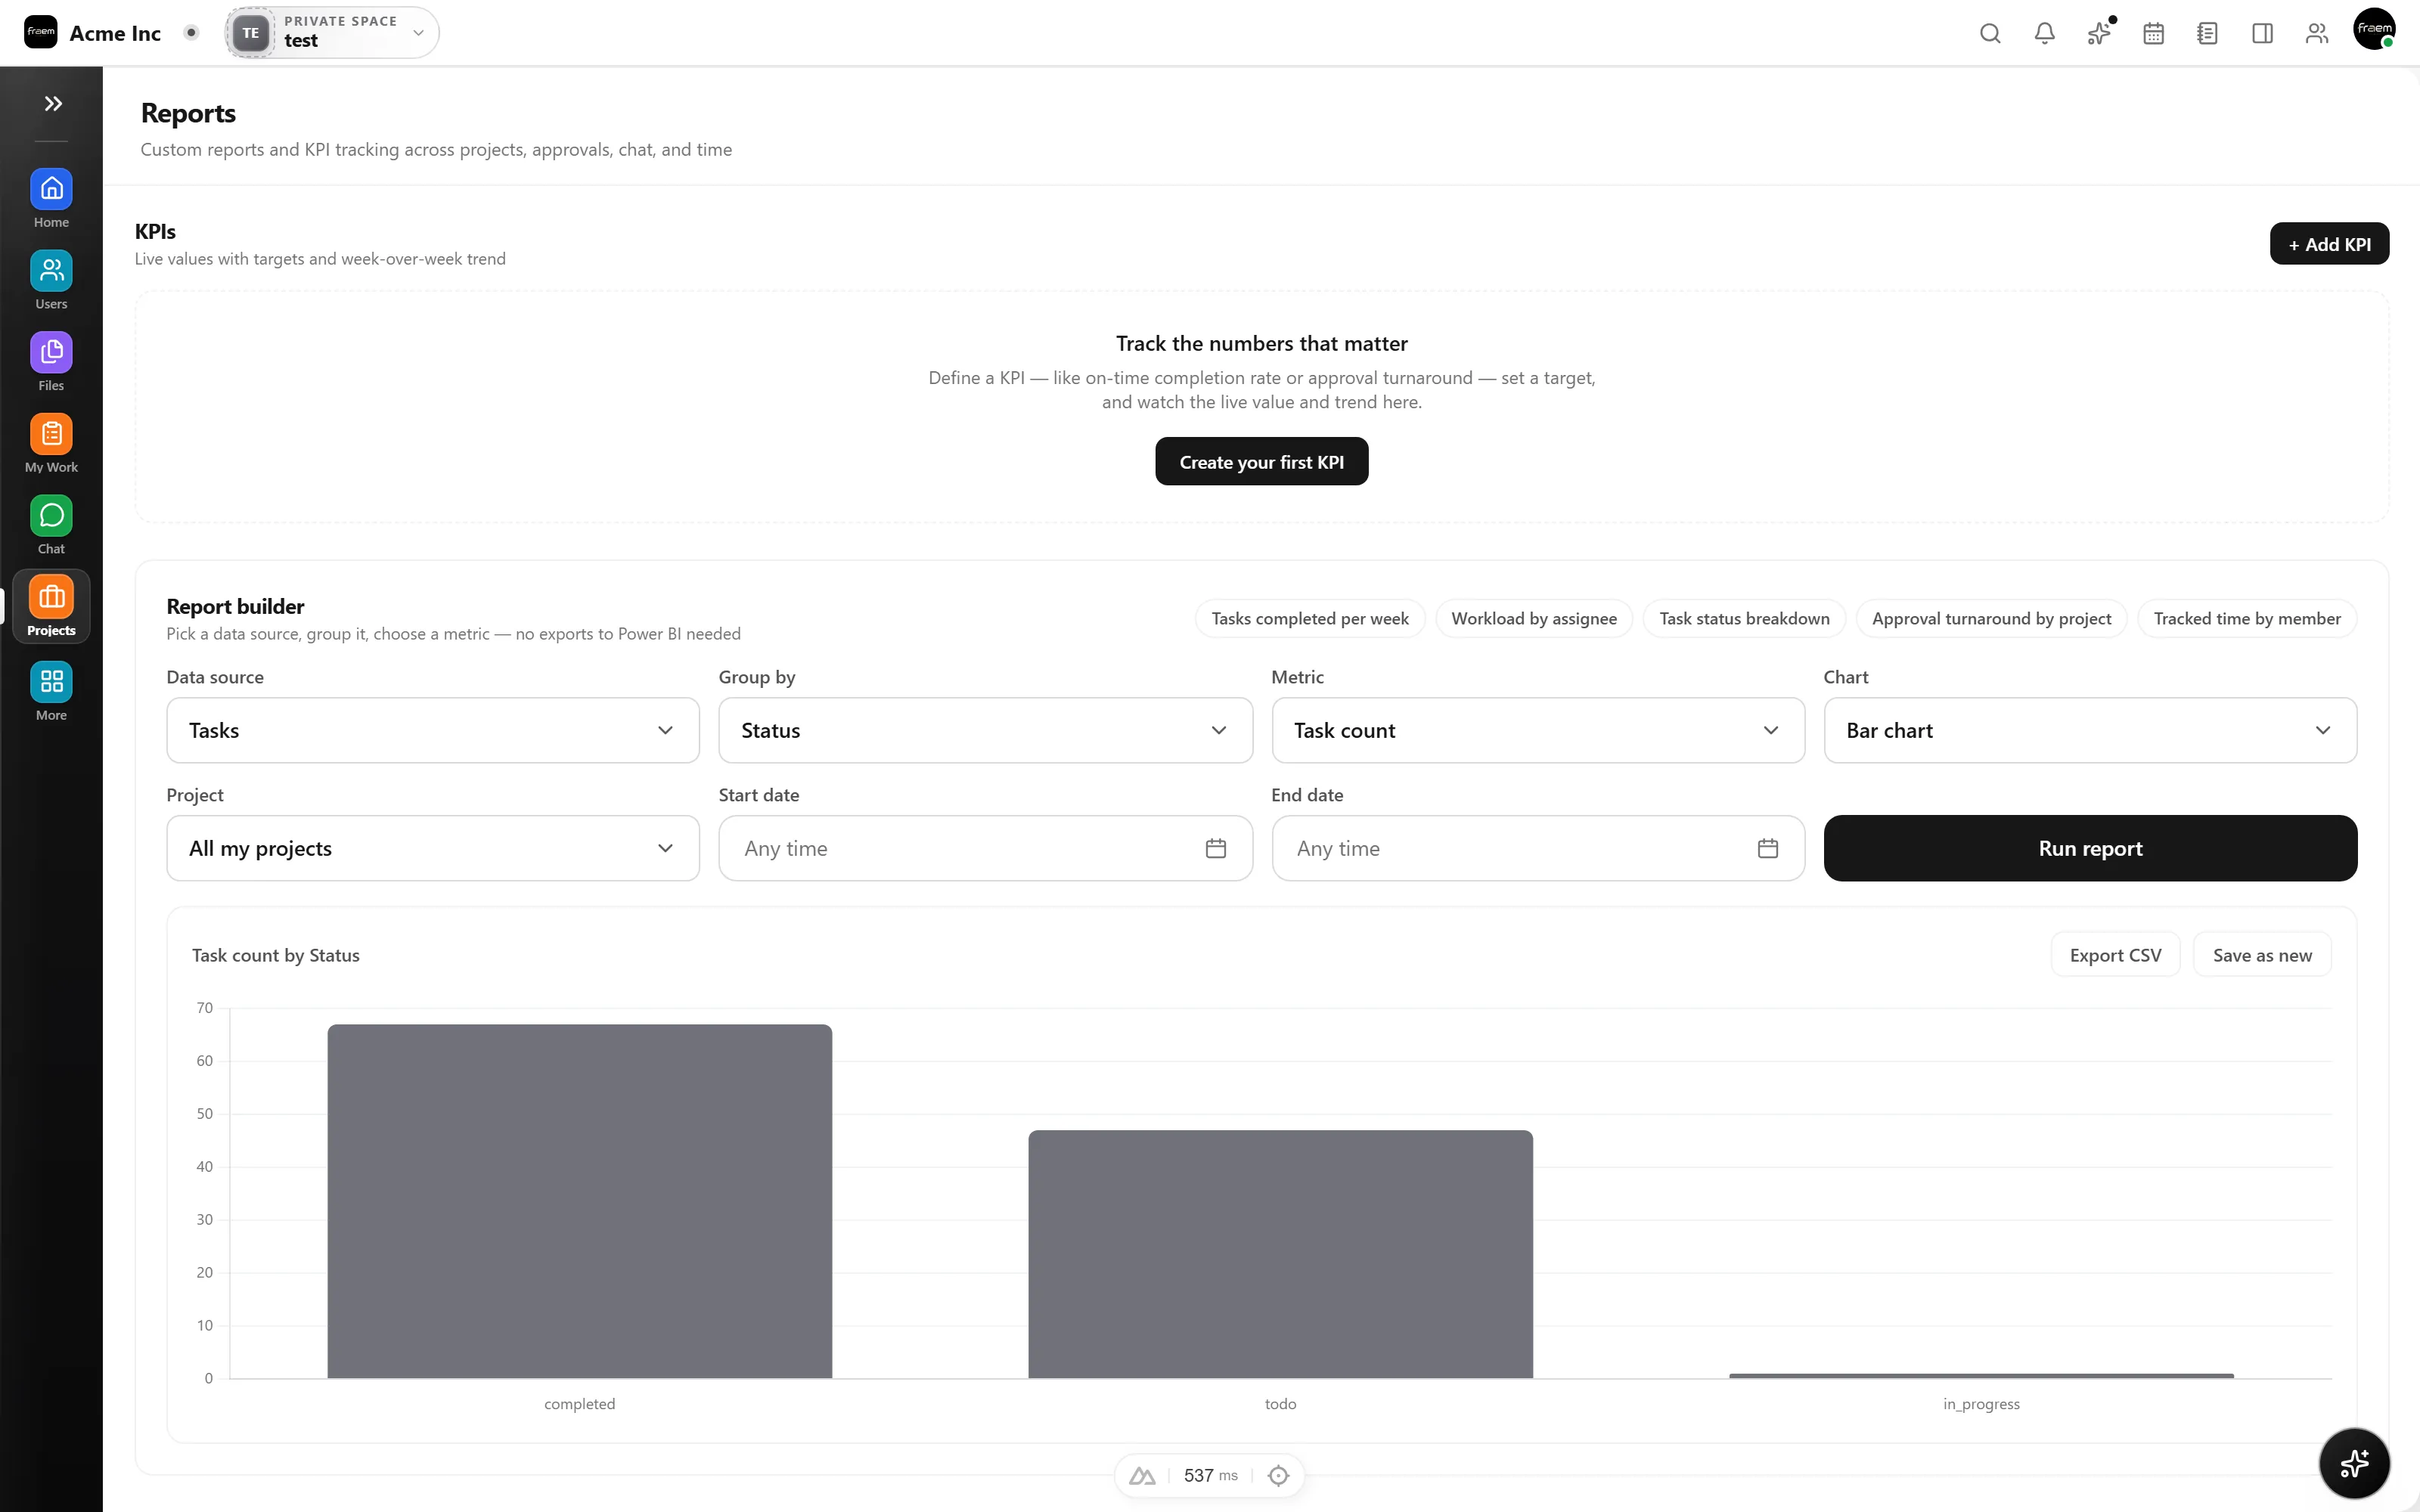
Build a report in a few clicks
Pick a source, choose how to group it, and select a metric, the chart updates instantly. Break tasks down by status, chart completed work per week, or compare approval turnaround by project, all without touching a spreadsheet.
- Sources: tasks, approvals, projects, and time tracking
- Group by status, priority, assignee, project, or day/week/month
- Line, bar, and doughnut chart views
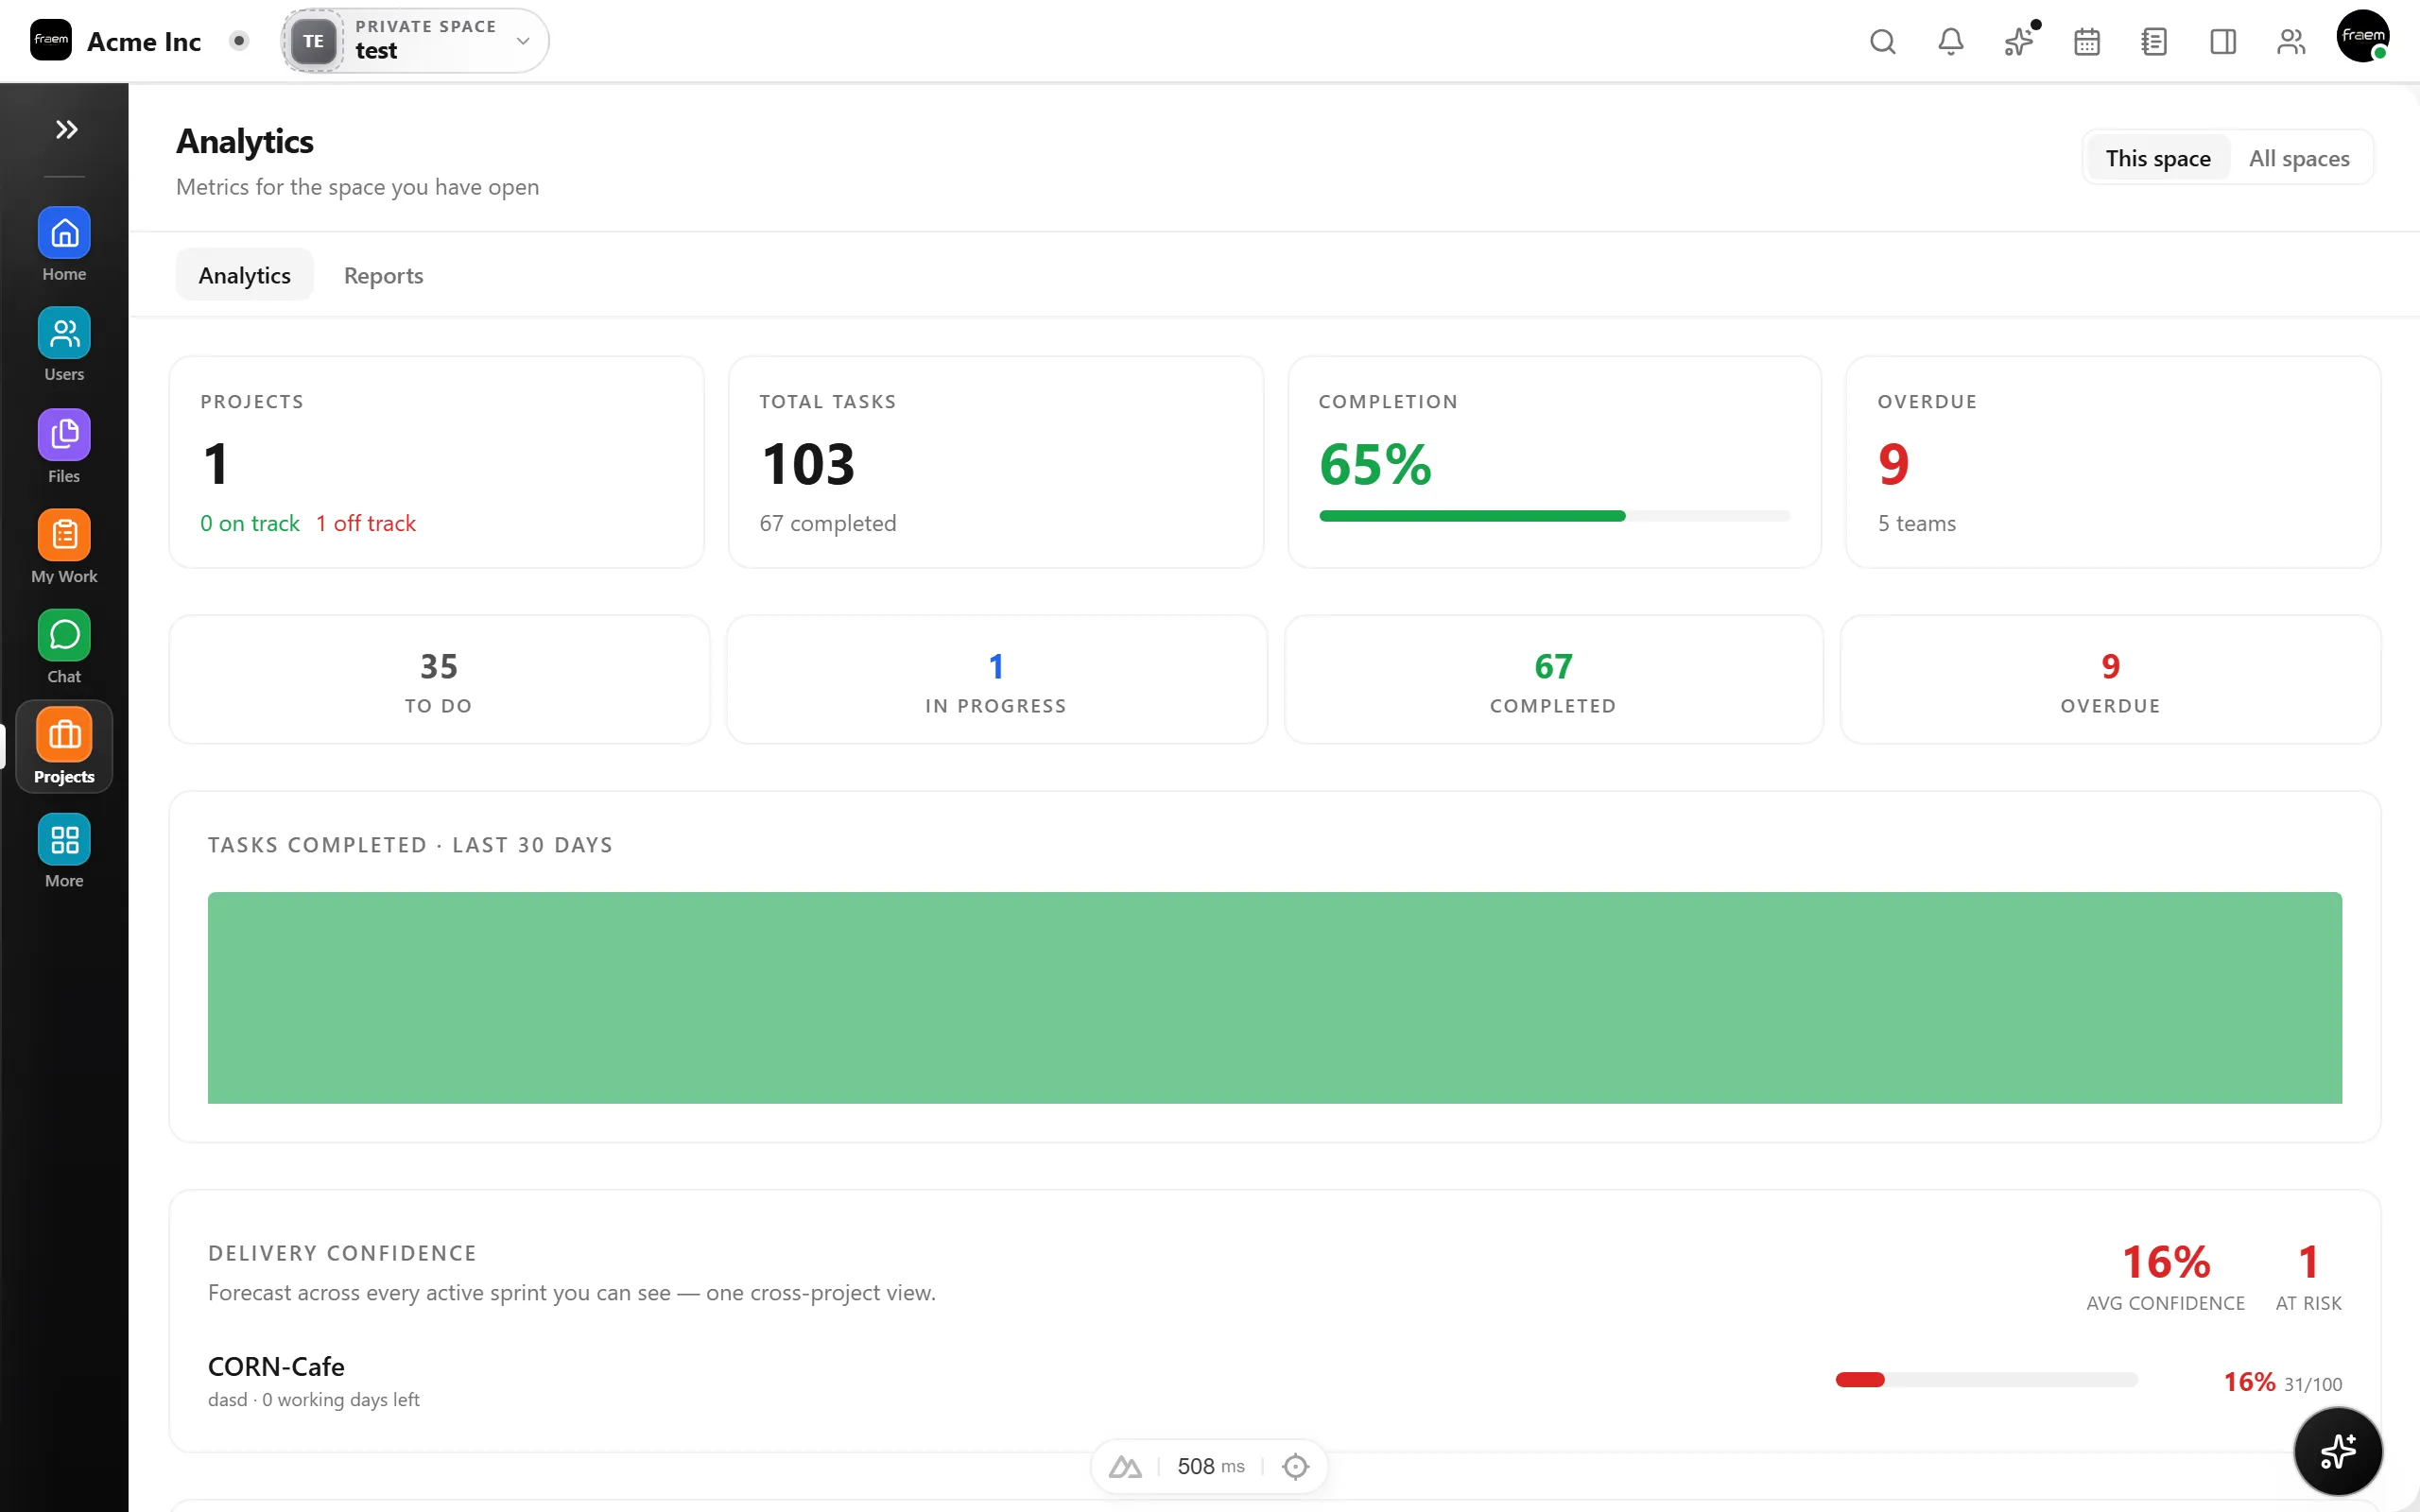
Track KPIs your team cares about
Put the numbers that matter on a dashboard, tasks completed, on time completion rate, overdue work, tracked time, approvals decided, and average approval turnaround, and keep them a glance away.
- Completion, on time rate, and overdue snapshots
- Tracked time, approvals decided, and turnaround
- Start from presets or save your own reports
FAQ
Frequently asked questions
Tasks, approvals, projects, and time tracking. You choose how to group the data, by status, priority, assignee, project, or time period, and pick a metric such as count, completion rate, or average turnaround.
No. Rowsh ships with presets like tasks completed per week, workload by assignee, and approval turnaround by project, and you can save any report you build for one click access later.
Reports run over your own workspace data with role based access, and queries use a safe, whitelisted set of sources and metrics rather than raw database access.
Ready to unify your workspace?
Create a workspace in minutes and explore Projects, Chat, Calendar, and Whiteboard together.
- Explore the published plans
- Choose the modules you need
- Isolated tenant workspaces