Sprint retrospectives
Review completion rates and velocity trends.
Projects
Understand progress and trends without manual spreadsheets or status decks.
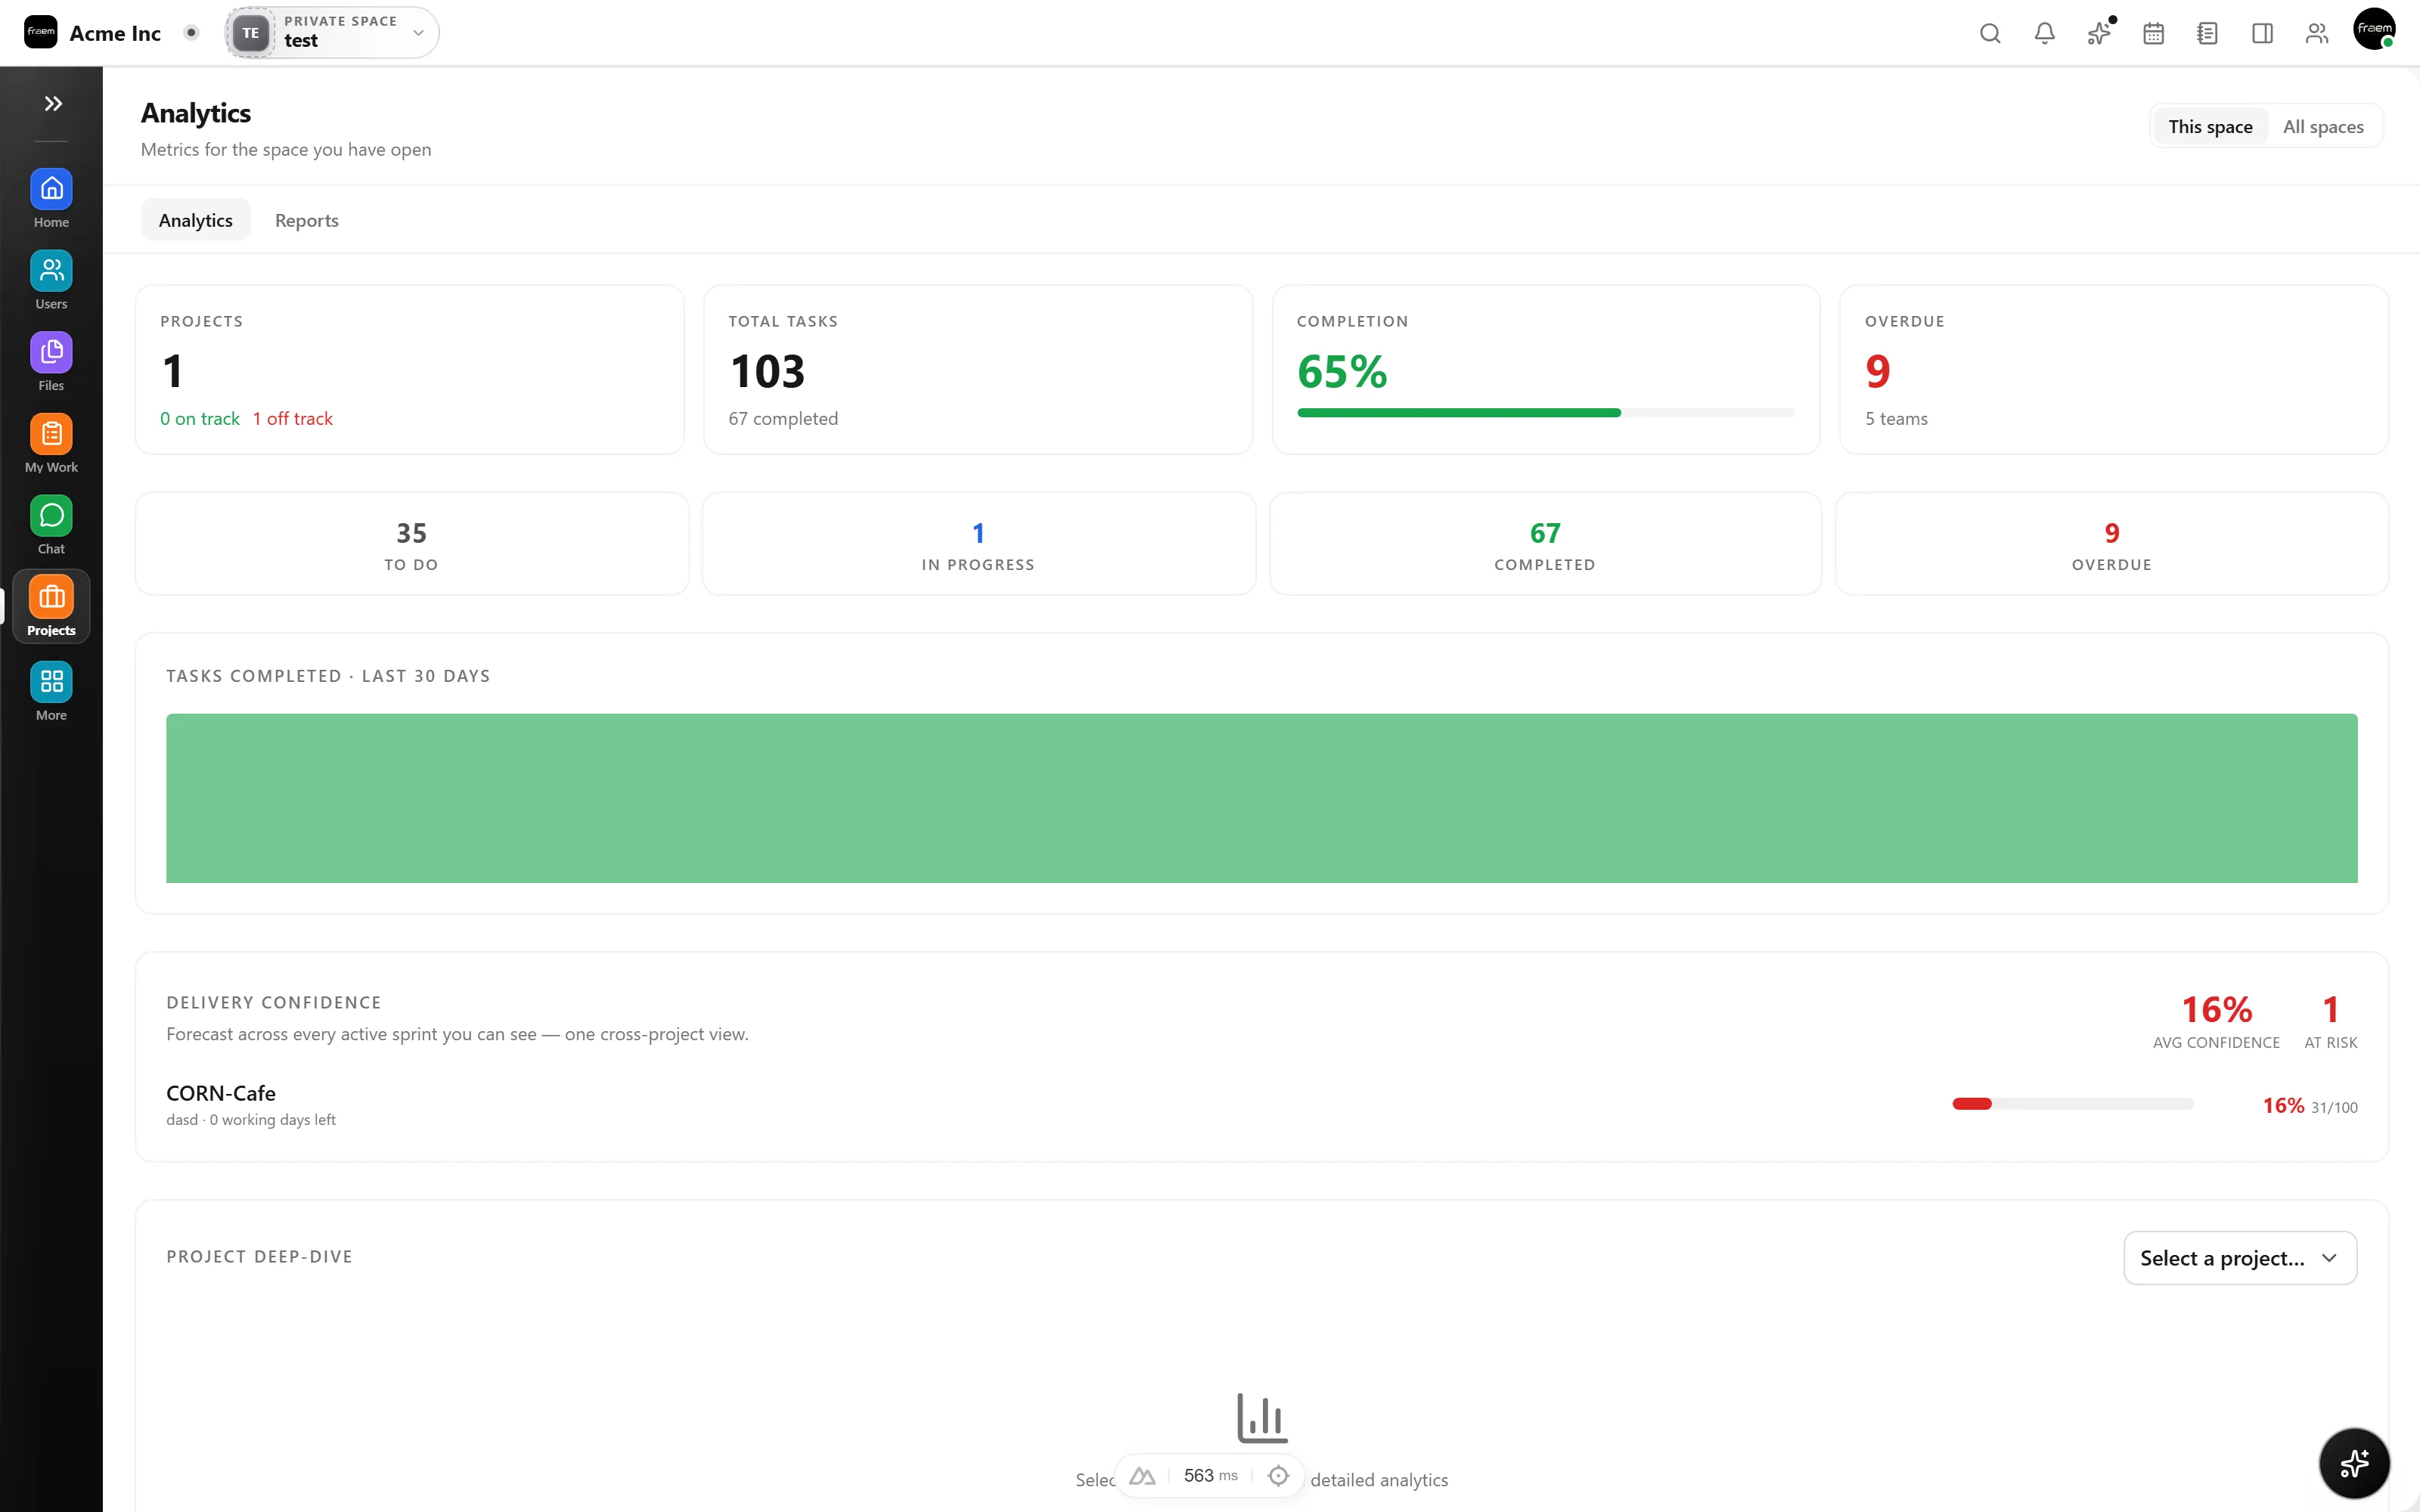
Analytics gives teams visibility into what is working and what is blocked. Use integrated reporting to make decisions faster and keep stakeholders aligned without manual spreadsheets.
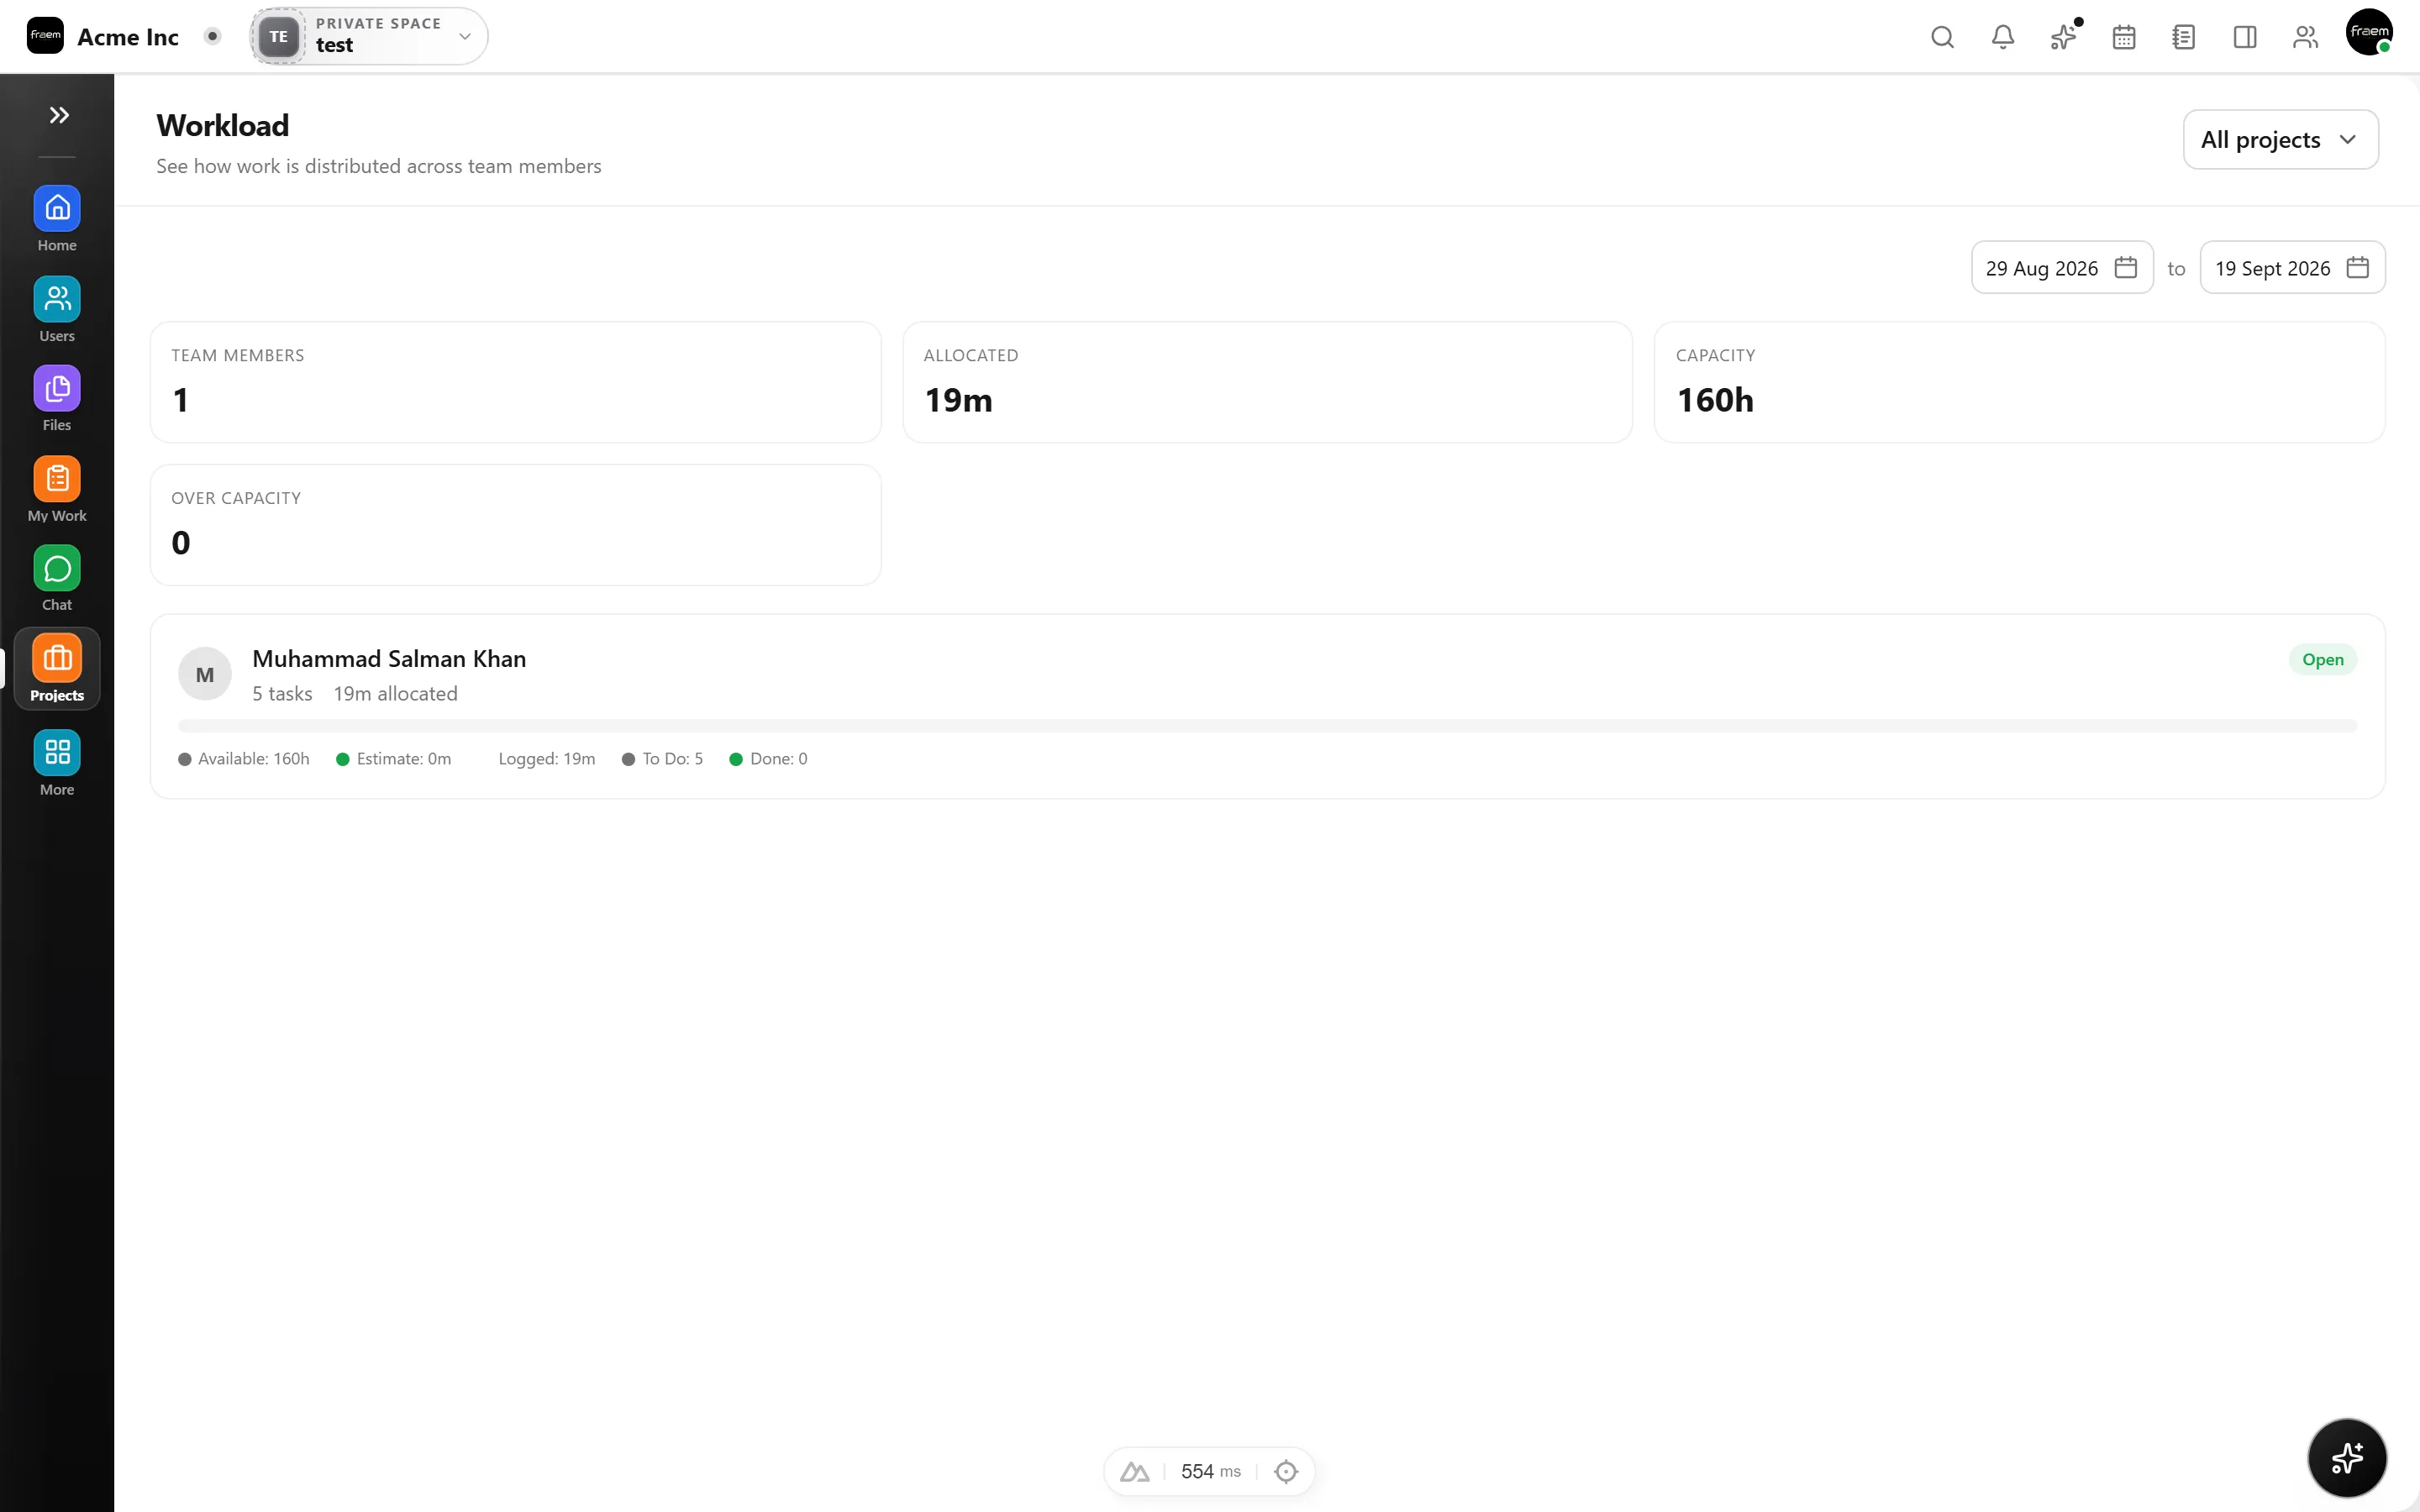
Roll up analytics across multiple projects for executive dashboards. See health signals, blocked work, and capacity gaps at the portfolio level, without assembling data from different tools.
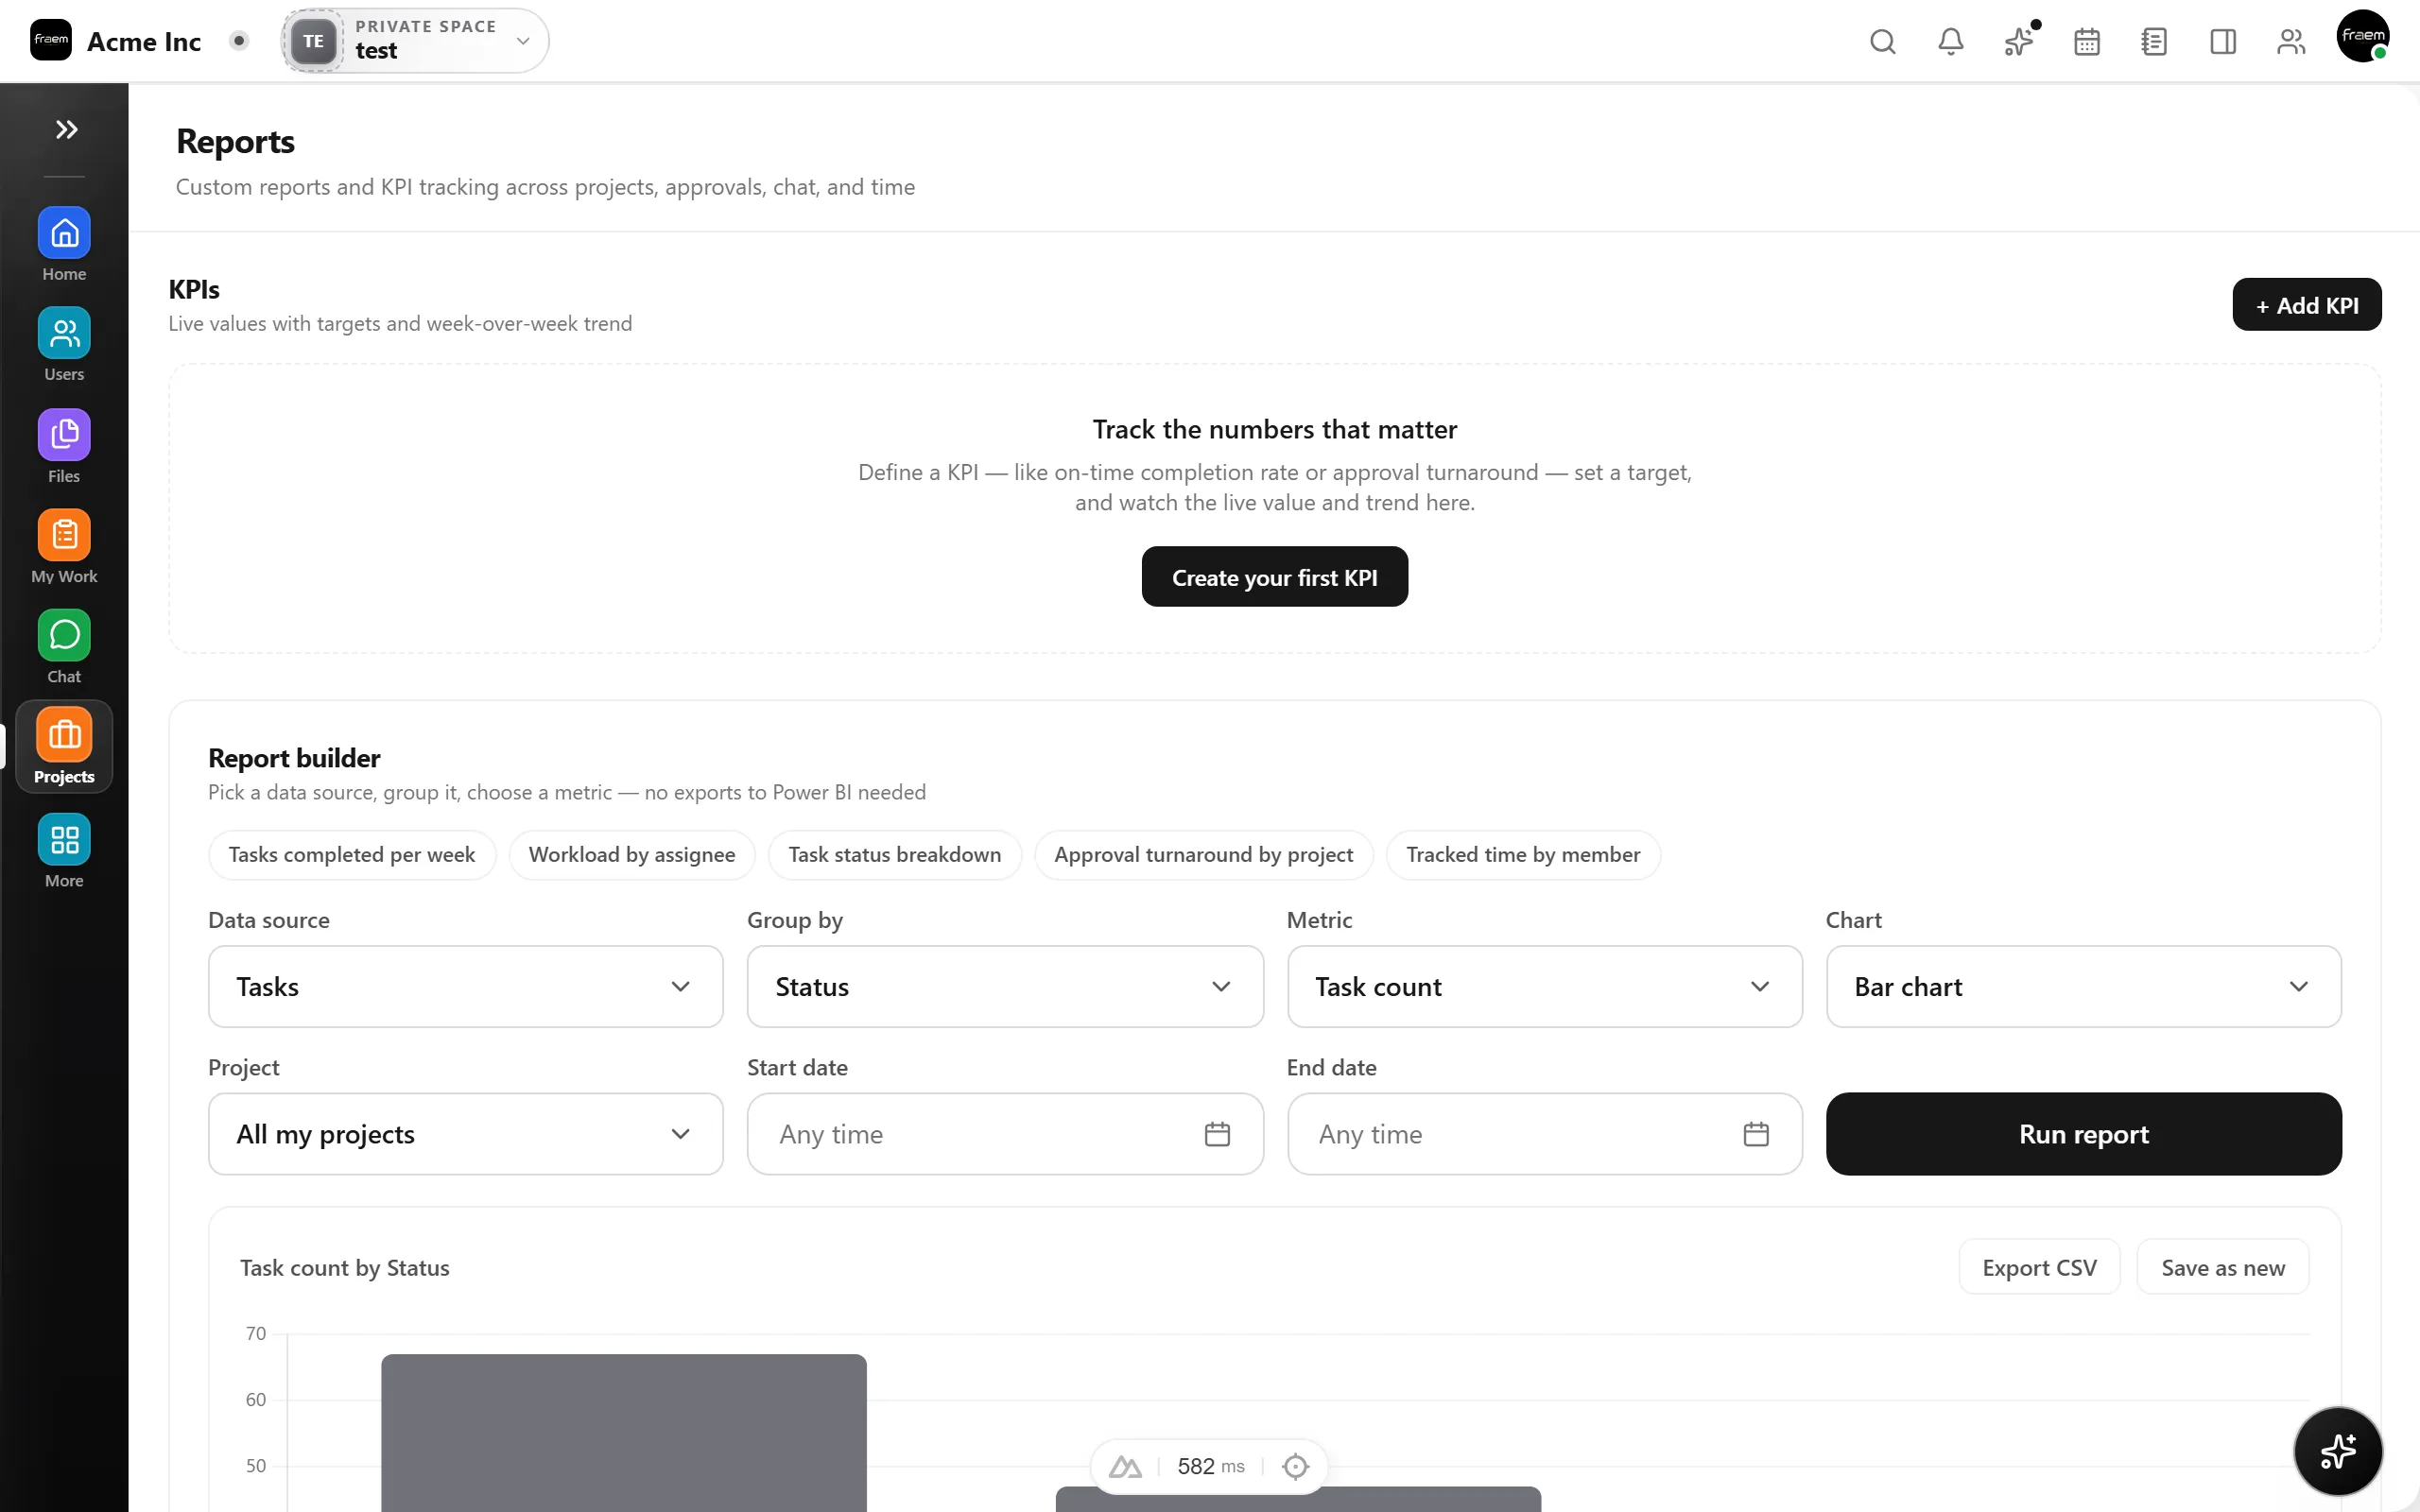
From daily standups to quarterly reviews, Analytics keeps everyone informed with real data.
Review completion rates and velocity trends.
See who is overloaded and redistribute work.
Measure progress toward OKRs with real data.
Spot blocked and overdue tasks early.
FAQ
Completion rates, throughput trends, workload distribution, overdue tasks, status breakdowns, and project health signals. All metrics update in real time as work moves forward.
Yes. You can slice analytics by team, assignee, project, priority, status, and date range to get the exact view you need.
Yes. Roll up multiple projects into portfolio dashboards for executive visibility and cross project health tracking.
Yes. Export options let you share reports with stakeholders who may not have direct workspace access.
Create a workspace in minutes and explore Projects, Chat, Calendar, and Whiteboard together.